All posts by Richard Herz

Where are you?

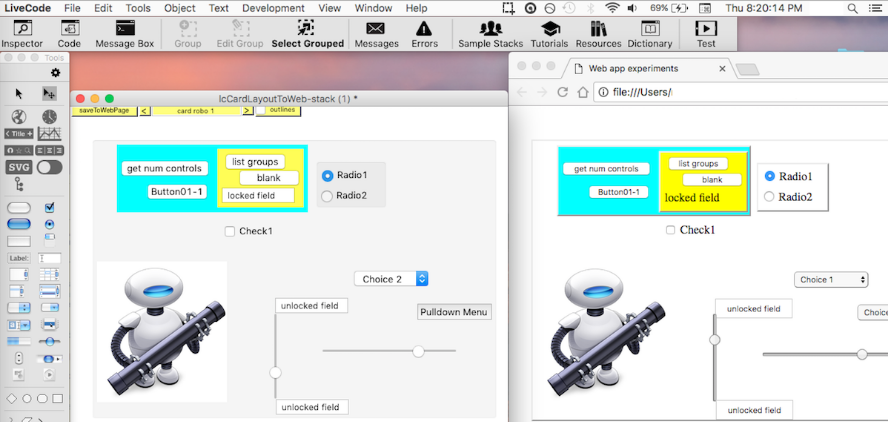
As long as we were teaching, we knew our notes and software were being used by our students. Now that we have retired, we have to analyze our web logs to see who is using the site and software. We are in the process of writing LiveCode scripts to scan through our logs and do some analysis. Here are some preliminary results for the month of February, 2018.

The first objective was to try to purge the logs of all web bots, spiders and crawlers. We were left with 20% of the original lines in the logs. I suspect that the bots/spiders/crawlers are indexing the PDF files in the RESOURCES section, which allows many users to find them in searches. Good in some aspects, but many users might not explore the rest of the site. All the RESOURCES content may be the reason that a search for “ReactorLab” or “Reactor Lab” puts our site at the top of page 1.

We were left with 3200 unique visitors after the purge, or simply “visitors” henceforth (unique IP addresses). This number roughly agrees with the Visitor Maps results in the NOW section. These visitors were from 107 different countries. The top five countries with the most activity were the US, India, Philippines, Ukraine, and the United Kingdom.

Of those 3200 total unique visitors, 2300 visitors from 96 countries used pages in the RESOURCES section of the site: 370 from 56 countries used the Matlab section, 1100 from 74 countries used the undergrad CRE Notes section, and 530 visitors from 66 countries used the Grad CRE section.

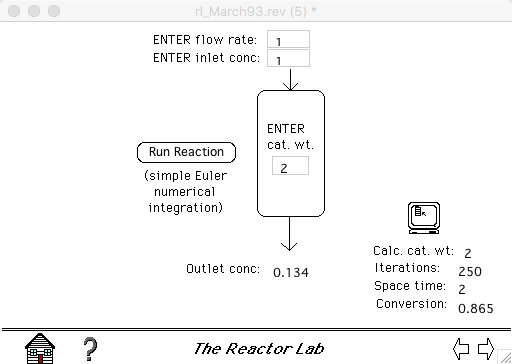
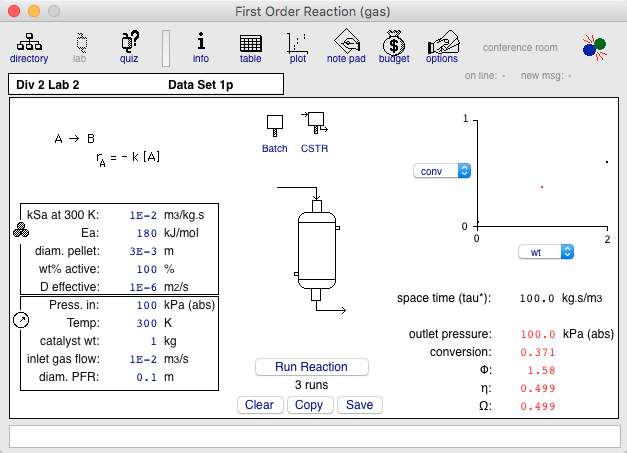
There were 59 visitors who downloaded the desktop software, and 86 visitors who ran the desktop software AND went “online.” There were six users of the Web Labs. Again, these numbers are for the month of February, 2018.

So far, I am pleased with what I am finding. I would be delighted to hear directly from you via email to   . Thanks.

A design example

We are interested in the general topic of “design.” In the desktop Reactor Lab, we started out with each new lab looking differently than the previous one. We also observed that students are interested in moving through an assignment quickly, and that this would be aided by designing a consistent layout that could be applied to most labs: input on the left, process in the center, output on the right. Once you learn how to navigate your first lab, you can use that knowledge to navigate the others.

We were lucky to go skiing recently and stay in an old lodge. During the night, we got too hot. I remembered a thermostat on the wall. With the lights off and the room dark, I adjusted the slider on the side of the thermostat to a lower position in order to lower the temperature in the room. Below is a photo of the thermostat taken the next morning. What do you think happened?

thermostat

We ended up cooking on top of the bed with the blankets off, even though the outside temperature was well below freezing! I had assumed that a lower temperature setting would mean sliding the control lower. Wrong! The more I tried to cool the room, the hotter it got.

What was the maker of the thermostat thinking? Maybe that Hell is down and hot, and clouds are up and cool? 😛

Design is not just nice to have. It is critical. Every time I hear about a disaster being blamed on “operator error,” I have a strong suspicion that the poor operators were trying to do their job – assuming they weren’t looking at their phones – but were more likely confused trying to operate a poorly designed system.

We recommend reading Don Norman’s recent post about the Hawaii false missile alarm, see especially the link to a photo of the operator’s software menu, and Norman’s book “The Design of Everyday Things.”

Open source SimzLab

We uploaded an open-source version of SimzLab to our github project at https://github.com/RichardHerz.

SimzLab was an extension of the concept of ReactorLab to enable different types of labs, or “courses,” to be distributed from a single platform. Originally, one of the courses in SimzLab was ReactorLab. We later took ReactorLab out of SimzLab and stopped development on SimzLab due to lack of development resources.

The current SimzLab includes PureWaterLab, a project about water purification, a process Control Lab, and a Heat Exchanger simulation.

The Download section of this web site has a standalone version of SimzLab for Windows OS. For other platforms, you can download and use the open-source version with the LiveCode development tool, which can be obtained at LiveCode.com.

Web Lab design progress

We have been working on our web page design project, lcCardLayoutToWeb, which is posted at GitHub. Here is a screenshot of a test page.

This project allows one to layout a web page in the LiveCode IDE, then export it to HTML and CSS files. The new work makes the process reversible. Exported pages can be edited to include links to Javascript files and references to Javascript functions in HTML events. Then the edited page can be imported into our LiveCode project for further editing of the layout: moving, adding and deleting elements. Then the revised page can be exported back to HTML and CSS files with the file and event references preserved.

This new work should allow us to make interactive web apps more easily.

See our newest Web Lab, “Dynamic diffusion and reaction in a porous solid catalyst” at the Web Labs tab above, Reactors. See the latest version of this web lab in our open-source projects at GitHub, https://github.com/RichardHerz/.

Space-time plot added to web lab

Space-time plots are a beautiful way to view dynamic reaction-diffusion systems. We added one to the Web Lab, “Dynamic diffusion and reaction in a porous solid catalyst.” Here is a static screen shot from the lab.

Adding this dynamic plot required learning how to program the HTML5 canvas element with Javascript – an exciting combination!

We prepared static plots of space-time data for our previous research work, e.g., at http://escholarship.org/uc/item/9bc7v3kv. We were inspired to make them dynamically by the fluid dynamics simulations of Oliver Hunt at https://nerget.com/fluidSim/ and Daniel Schroeder at http://physics.weber.edu/schroeder/fluids/. Those pages showed us that this was possible to do in a web page.

New Web Lab posted, dynamic catalytic reaction-diffusion

We posted a new web lab with a simulation of dynamic diffusion and reaction in a porous, solid catalyst layer.

This our first web lab with multiple plots: two strip charts showing time history, and two profile charts showing time-varying concentration profiles in the catalyst layer. The way we handle data for these plots is different than we do in Lab 1, which has one strip chart plot. Our code structure continues to be under development.

Web Labs are a new name for our Web app experiments. We moved the link to the Web Labs out of Resources to the top menu bar. One reason is the we are getting more interested in HTML5 for interactive simulations. We initially developed the new lab with LiveCode but found its speed too slow to handle solution of the partial differential equations. Javascript was much faster for this application.

Web app code structure

The first two web labs listed at the Web Labs tab have the latest Javascript code structure. Our approach is to have a collection of Javascript code objects, each of which represent individual process units, or “unit operations” in chemical engineering terminology. Each process unit object contains definitions of variables that define the current unit state, and methods that update the unit state at each time step. One objective is to make the unit code objects as independent as possible so that they can be copied and used in other simulations.

In an earlier post, we mentioned the web apps being developed by Tony Butterfield. His web apps have a different structure than ours, and it is interesting to compare these two approaches. You can view the source code of the web apps by choosing View Source in your web browser.

Butterfield’s web apps have a parent code object that defines a child object for each variable in the simulation. This is in contrast to our collection of process unit objects. You might say his app structure is variable-centered, whereas ours is process-unit centered. His variable object definition appears to have been entered in a spreadsheet and then translated to Javascript, since it is minified.

Butterfield’s web apps have a single method that updates the state of the simulation at each time step, vs. our process unit objects, each of which contain a method to update themselves at each time step. For plotting, his web apps record variables values at each time step in each variable object, vs. our 3D numeric array that records the history of all variable values, with individual process objects storing only their current values.

Both approaches work, and it is valuable to have a choice for web app development.

Margaret Hamilton and another approach to software development

I was interested to learn about the work of Margaret Hamilton, who was awarded the Presidential Medal of Freedom yesterday. As a young woman, she led a team that designed the flight control software for the Apollo moon landers. This period was during the early days of computer programming when software design practices were just starting to be invented. Hamilton developed a theory and methodology for “design before the fact” of fault-free and fault-tolerant, real-time software control systems. The class of systems considered are asynchronous, discrete-event systems. This includes chemical batch process scheduling and control. Our web apps simulate continuous processes. Design Before the Fact contrasts with the development strategy we use, as outlined in my last post, but we will learn from Hamilton’s work.

Also at the ceremony at the White House yesterday, Grace Hopper was posthumously awarded the Presidential Medal of Freedom. She was an early pioneer in computing, invented the first software compiler, and popularized the idea of machine-independent programming languages.

Also see the blog post about other women engineers who were key figures in the moon landings.