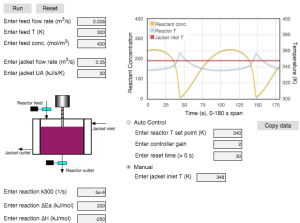
Space-time plots are a beautiful way to view dynamic reaction-diffusion systems. We added one to the Web Lab, “Dynamic diffusion and reaction in a porous solid catalyst.” Here is a static screen shot from the lab.
Adding this dynamic plot required learning how to program the HTML5 canvas element with Javascript – an exciting combination!
We prepared static plots of space-time data for our previous research work, e.g., at http://escholarship.org/uc/item/9bc7v3kv. We were inspired to make them dynamically by the fluid dynamics simulations of Oliver Hunt at https://nerget.com/fluidSim/ and Daniel Schroeder at http://physics.weber.edu/schroeder/fluids/. Those pages showed us that this was possible to do in a web page.

