The women who helped put men on the moon

Article in Los Angeles Times by Molly Hennessy-Fiske, July 18, 2019, p. A1

https://enewspaper.latimes.com/infinity/article_share.aspx?guid=db7ff914-40c3-4690-b069-36c36b4f8e9e

This year is the 50th anniversary of Apollo 11 astronauts landing on the Moon. Article includes stories of Frances Northcutt, Christine Darden, and Sylvia Salinas Stottlemyer.

Also see the blog post about Margaret Hamilton, another key figure.

Excerpt:

The Civil Rights Act had just passed and the slide rule was giving way to computers when Frances “Poppy” Northcutt arrived at NASA’s Houston campus in 1965, eager to join the space race. But her job title stunned her: “computress.” https://en.wikipedia.org/wiki/Frances_Northcutt

Northcutt, then 22 and fresh out of the University of Texas at Austin with a mathematics degree, soon learned that at NASA, men were engineers, women “computresses” or “human computers,” with less status and less pay.

But Northcutt persevered, and three years later, during the Apollo 8 mission, she would become the first woman to work in Mission Control. …
Happy 100th Birthday to Katherine Johnson

Happy 100th birthday to Katherine Johnson, NASA mathematician portrayed in the movie “Hidden Figures.” As shown in the movie, she proposed using Euler’s method to compute trajectories and orbits for the first US astronauts, allowing safe journeys and landings. In her honor, we will add an Euler’s method problem to homework in our intro to programming course. See her entry at Wikipedia and news articles, e.g., here and here. See our previous blog post about Katherine.

Web Lab development update

We now have six web labs posted. The newest is the dynamic heat exchanger simulation, and we recently updated the code structure of the reaction-diffusion lab and first temperature control lab to match the newest version.

In addition to the jquery and flot (plotting) libraries, each web lab is driven by six javascript files: (1) _main which runs the simulation loop, (2) _interface which handles the run-pause and reset buttons and gets and verifies inputs from the input fields, (3) _units which has simulation parameters and the process unit code, (4) _plot_info which contains definitions of the plots, (5) _plotter which makes the profile (static x,y) and strip chart (scrolling x,y) plots, and (6) _spacetime which makes the space-time, color-canvas plots.

Four of the six files are the same for all web labs. The two files specific to an individual web lab are the (3) _units and (4) _plot_info files.

We are amazed with the fast computational speed of javascript! Somewhere recently I read that the speed of javascript in browsers has increased by a factor of ten in the last year and a half. Years ago, computation in LiveCode (as MetaCard) was many times faster than javascript. Now, computation in javascript for our labs is much faster than native LiveCode script, although LiveCode 9 makes coupling to other languages for computation possible.

A feature unique to the heat exchanger lab is a check for attainment of steady state. When no significant changes to the system state are detected, the main simulation loop continues to run but unit computations and display updates cease until a change in input parameters is detected. When steady state is reached, the CPU load of the simulation decreases significantly. We don’t plan to implement this for the reaction-diffusion and temperature control labs because these usually operate under unsteady-state conditions.

The code is developing over time as we follow our usual development practice, which is repeat the following: (1) get something working, (2) notice repetition, (3) reduce repetition by writing functions and common library files.

25th anniversary of Reactor Lab this month!

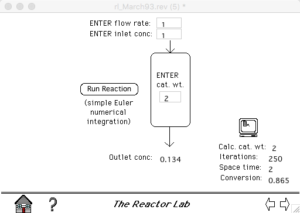
Reactor Lab is a pioneer in developing interactive simulations for active learning. This is a screenshot of an experiment in the Lab in March 1993 – 25 years ago this month. The Lab was a single HyperCard stack. Click on the image to see a larger version.

RL_March_1993

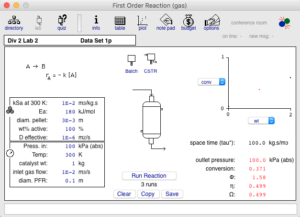
Here is the same experiment in today’s desktop Reactor Lab.

RL_now

A brief history of the development of Reactor Lab through 2006 is available at LiveCode Journal (hit browser back button to return here). The article refers to Revolution, which was LiveCode’s previous name. LiveCode is the development tool used to build the desktop version of ReactorLab.

Where are you?

As long as we were teaching, we knew our notes and software were being used by our students. Now that we have retired, we have to analyze our web logs to see who is using the site and software. We are in the process of writing LiveCode scripts to scan through our logs and do some analysis. Here are some preliminary results for the month of February, 2018.

The first objective was to try to purge the logs of all web bots, spiders and crawlers. We were left with 20% of the original lines in the logs. I suspect that the bots/spiders/crawlers are indexing the PDF files in the RESOURCES section, which allows many users to find them in searches. Good in some aspects, but many users might not explore the rest of the site. All the RESOURCES content may be the reason that a search for “ReactorLab” or “Reactor Lab” puts our site at the top of page 1.

We were left with 3200 unique visitors after the purge, or simply “visitors” henceforth (unique IP addresses). This number roughly agrees with the Visitor Maps results in the NOW section. These visitors were from 107 different countries. The top five countries with the most activity were the US, India, Philippines, Ukraine, and the United Kingdom.

Of those 3200 total unique visitors, 2300 visitors from 96 countries used pages in the RESOURCES section of the site: 370 from 56 countries used the Matlab section, 1100 from 74 countries used the undergrad CRE Notes section, and 530 visitors from 66 countries used the Grad CRE section.

There were 59 visitors who downloaded the desktop software, and 86 visitors who ran the desktop software AND went “online.” There were six users of the Web Labs. Again, these numbers are for the month of February, 2018.

So far, I am pleased with what I am finding. I would be delighted to hear directly from you via email to   . Thanks.

A design example

We are interested in the general topic of “design.” In the desktop Reactor Lab, we started out with each new lab looking differently than the previous one. We also observed that students are interested in moving through an assignment quickly, and that this would be aided by designing a consistent layout that could be applied to most labs: input on the left, process in the center, output on the right. Once you learn how to navigate your first lab, you can use that knowledge to navigate the others.

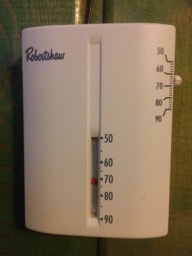
We were lucky to go skiing recently and stay in an old lodge. During the night, we got too hot. I remembered a thermostat on the wall. With the lights off and the room dark, I adjusted the slider on the side of the thermostat to a lower position in order to lower the temperature in the room. Below is a photo of the thermostat taken the next morning. What do you think happened?

thermostat

We ended up cooking on top of the bed with the blankets off, even though the outside temperature was well below freezing! I had assumed that a lower temperature setting would mean sliding the control lower. Wrong! The more I tried to cool the room, the hotter it got.

What was the maker of the thermostat thinking? Maybe that Hell is down and hot, and clouds are up and cool? 😛

Design is not just nice to have. It is critical. Every time I hear about a disaster being blamed on “operator error,” I have a strong suspicion that the poor operators were trying to do their job – assuming they weren’t looking at their phones – but were more likely confused trying to operate a poorly designed system.

We recommend reading Don Norman’s recent post about the Hawaii false missile alarm, see especially the link to a photo of the operator’s software menu, and Norman’s book “The Design of Everyday Things.”

Open source SimzLab

We uploaded an open-source version of SimzLab to our github project at https://github.com/RichardHerz.

SimzLab was an extension of the concept of ReactorLab to enable different types of labs, or “courses,” to be distributed from a single platform. Originally, one of the courses in SimzLab was ReactorLab. We later took ReactorLab out of SimzLab and stopped development on SimzLab due to lack of development resources.

The current SimzLab includes PureWaterLab, a project about water purification, a process Control Lab, and a Heat Exchanger simulation.

The Download section of this web site has a standalone version of SimzLab for Windows OS. For other platforms, you can download and use the open-source version with the LiveCode development tool, which can be obtained at LiveCode.com.

Web Lab design progress

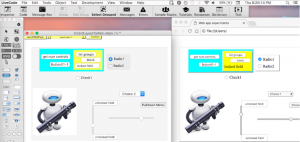
We have been working on our web page design project, lcCardLayoutToWeb, which is posted at GitHub. Here is a screenshot of a test page.

This project allows one to layout a web page in the LiveCode IDE, then export it to HTML and CSS files. The new work makes the process reversible. Exported pages can be edited to include links to Javascript files and references to Javascript functions in HTML events. Then the edited page can be imported into our LiveCode project for further editing of the layout: moving, adding and deleting elements. Then the revised page can be exported back to HTML and CSS files with the file and event references preserved.

This new work should allow us to make interactive web apps more easily.

See our newest Web Lab, “Dynamic diffusion and reaction in a porous solid catalyst” at the Web Labs tab above. See the latest version of this web lab in our open-source projects at GitHub, https://github.com/RichardHerz/.

Space-time plot added to web lab

Space-time plots are a beautiful way to view dynamic reaction-diffusion systems. We added one to the Web Lab, “Dynamic diffusion and reaction in a porous solid catalyst.” Here is a static screen shot from the lab.

Adding this dynamic plot required learning how to program the HTML5 canvas element with Javascript – an exciting combination!

We prepared static plots of space-time data for our previous research work, e.g., at http://escholarship.org/uc/item/9bc7v3kv. We were inspired to make them dynamically by the fluid dynamics simulations of Oliver Hunt at https://nerget.com/fluidSim/ and Daniel Schroeder at http://physics.weber.edu/schroeder/fluids/. Those pages showed us that this was possible to do in a web page.